Porritt et al. (2011)
Investigation of Cascadia segmentation with ambient noise tomography
Robert W. Porritt, Richard M. Allen, Devin C. Boyarko, and Michael R. Brudzinski

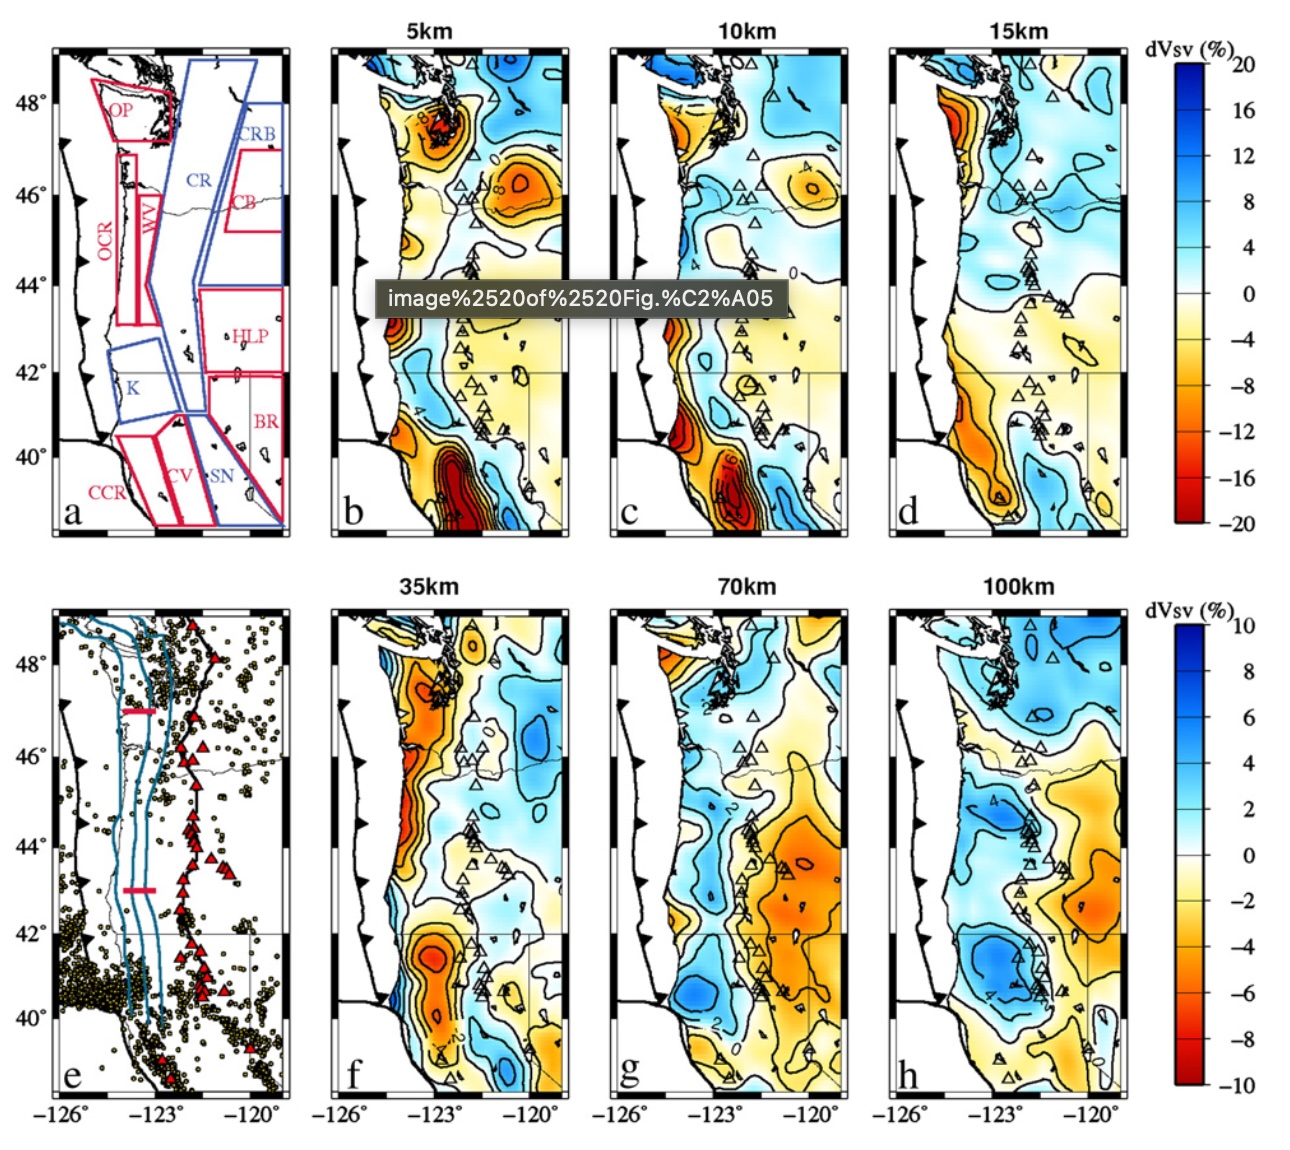
Figure 1:Tectonic maps of the study region. (a) Highlights crustal structure showing sedimentary regions in red and igneous/metamorphic regions in blue. OP— Olympic Peninsula, CR— Cascades Range, CRB— Columbia River Basalts, OCR— Oregon Coast Range, WV— Willamette Valley, CB— Columbia Basin, K— Klamath Mountains, HLP— High Lava Plains, BR— Basin and Range, CCR— California Coast Range, CV— Central Valley, SN— Sierra Nevada. (e) shows earthquakes since 1990 (gold dots), tremor segmentation bounds (red lines), volcanoes (red triangles), depth to slab contours at 20, 30, and 40 km from Audet et al. (2010) (blue lines), and the locations of profiles in Figs. 7 and 8. (b–d, f–i) Depth slices of PNW10-S at 5, 10, 15, 35, 70, and 100 km. Overlain on the depth slices are the quaternary volcanic centers as unfilled triangles.
Summary
Along strike variation in the characteristics of subduction zone processes has been observed throughout the Cascadia Subduction Zone through magmas analysis of arc magmas and the distribution of seismicity. We investigate links between these observations and subduction zone structure by imaging three-dimensional lithospheric scale shear velocity with ambient noise tomography (ANT). The crustal portion of the model is well resolved through typical ANT processing techniques. We expand the methodology to use longer period phase velocities in order to recover structure to ~ 120 km depth. The resulting model, PNW10-S, represents structural information in terms of relative shear velocity in the crust and uppermost mantle. Crustal structure mirrors surface geology to ~ 10 km depth and then transitions to a structure that is dominated by the subducting slab. The subducting slab and overriding crust appear segmented into three parts with boundaries near 43°N and 46°N. This three-way structural segmentation is aligned with the variation in recurrence of episodic tremor and slip along the subduction zone. Upper to middle crustal boundaries between the Klamath Mountains and Siletzia Terrane (43°N) and between the Crescent Formation and Olympic Peninsula (47°N) are also coincident with locations of increased occurrence of tremors raising the question of whether there is a link between the intensity of tremor activity and shallow (< 10 km) crustal structure. The slab–segment boundary at 43°N is a stronger feature than the northern segment boundary at 46°N and appears to be the continuation of the Blanco Fracture Zone separating the Gorda segment of the plate from the rest of the Juan de Fuca plate. The southern half of the arc system, south of 45°N, shows lower velocities from the surface to ~ 80 km depth relative to the northern portion of the arc. We propose that this is due to clockwise plate rotation, which causes extension in the south, and results in increased melting. Along the arc, four broad low-velocity features are imaged just below the Moho and centered at 42°N, 44°N, 47°N, and 49°N. We interpret these as ponding of melt just below the crust where differentiation can occur before further ascent through the crust.
Model Information
SUMMARY: PACNW10-S was created from the iterative linear inversion of ambient noise Rayleigh waves dispersion measurements
MODEL TYPE: V and V perturbation
MINIMUM LONGITUDE: -124.2
MAXIMUM LONGITUDE: -119
LONGITUDE RESOLUTION: 0.2
MINIMUM LATITUDE: 38.2
MAXIMUM LATITUDE: 49
LATITUDE RESOLUTION: 2.5
MINIMUM DEPTH: 0 km
MAXIMUM DEPTH: 100 km
- Porritt, R. W., Allen, R. M., Boyarko, D. C., & Brudzinski, M. R. (2011). Investigation of Cascadia segmentation with ambient noise tomography. Earth and Planetary Science Letters, 309(1–2), 67–76. 10.1016/j.epsl.2011.06.026