Janiszewski et al. (2019)
Amphibious surface-wave phase-velocity measurements of the Cascadia subduction zone
Helen A. Janiszewski, James B. Gaherty, Geoffrey A. Abers, Haiying Gao, and Zachary C. Eilon

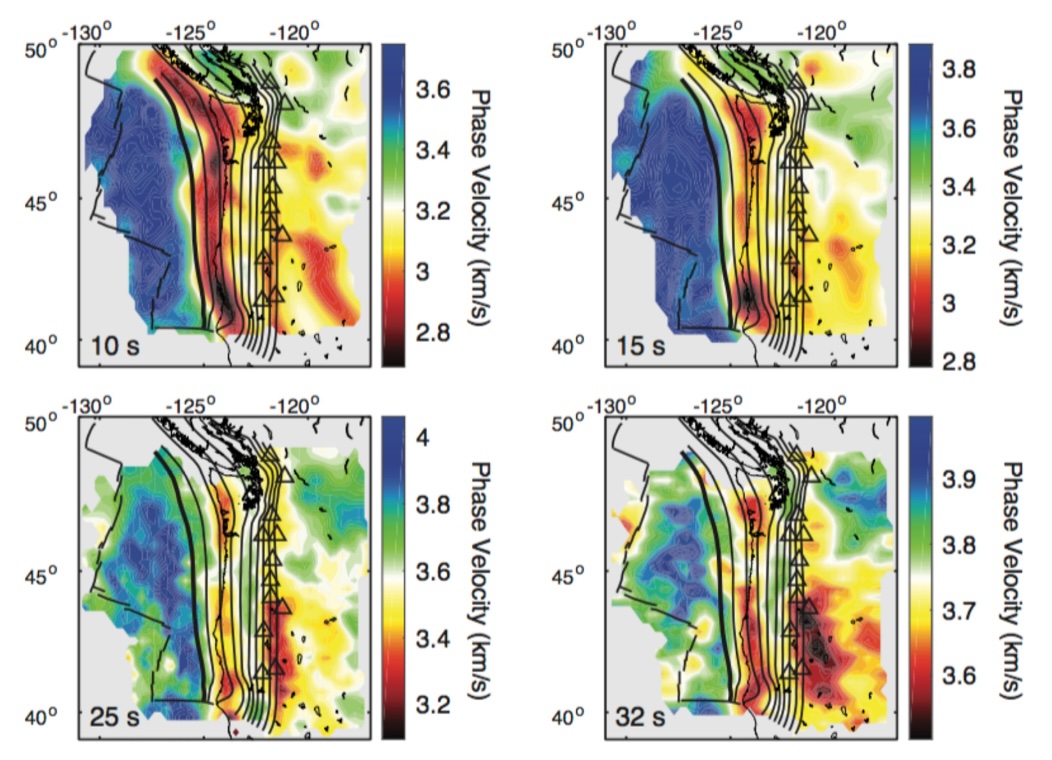
Figure 1:Phase-velocity maps from both ambient-noise (10 and 15 s) and earthquake (20–100 s) data.
Summary
A new amphibious seismic data set from the Cascadia subduction zone is used to characterize the lithosphere structure from the Juan de Fuca ridge to the Cascades backarc. These seismic data are allowing the imaging of an entire tectonic plate from its creation at the ridge through the onset of the subduction to beyond the volcanic arc, along the entire strike of the Cascadia subduction zone. We develop a tilt and compliance correction procedure for ocean-bottom seismometers that employs automated quality control to calculate robust station noise properties. To elucidate crust and upper-mantle structure, we present shoreline-crossing Rayleigh-wave phase-velocity maps for the Cascadia subduction zone, calculated from earthquake data from 20 to 160 s period and from ambient-noise correlations from 9 to 20 s period. We interpret the phase-velocity maps in terms of the tectonics associated with the Juan de Fuca plate history and the Cascadia subduction system. We find that thermal oceanic plate cooling models cannot explain velocity anomalies observed beneath the Juan de Fuca plate. Instead, they may be explained by a ≤1 per cent partial melt region beneath the ridge and are spatially collocated with patches of hydration and increased faulting in the crust and upper mantle near the deformation front. In the forearc, slow velocities appear to be more prevalent in areas that experienced high slip in past Cascadia megathrust earthquakes and generally occur updip of the highest-density tremor regions and locations of intraplate earthquakes. Beneath the volcanic arc, the slowest phase velocities correlate with regions of highest magma production volume.
Model Information
SUMMARY: Rayleigh wave phase velocities from ambient noise and earthquakes using Eikonal and Helmholtz tomography
MODEL TYPE: V
MINIMUM LONGITUDE: -131
MAXIMUM LONGITUDE: -117.2
LONGITUDE RESOLUTION: 0.3
MINIMUM LATITUDE: 39
MAXIMUM LATITUDE: 49.8
LATITUDE RESOLUTION: 0.3
MINIMUM DEPTH: 9 km
MAXIMUM DEPTH: 160 km
- Janiszewski, H. A., Gaherty, J. B., Abers, G. A., Gao, H., & Eilon, Z. C. (2019). Amphibious surface-wave phase-velocity measurements of the Cascadia subduction zone. Geophysical Journal International, 217(3), 1929–1948. 10.1093/gji/ggz051