Cascadia Landslide Data Post-Processing#
ShakeMap Integration and Unique ID Addition#
This notebook performs final post-processing on Cascadia landslide dataset:
Adding USGS M9 scenario ShakeMap seismic intensity data and adding unique identifiers to create the final dataset for visualization and analysis.
rainfall data from the rainfall notebook
ShakeMap Integration#
This notebook integrates USGS ShakeMap intensity data with Cascadia landslide location data. The ShakeMap data is available at https://earthquake.usgs.gov/scenarios/eventpage/cszm9ensemble_se/shakemap/intensity.
The process involves several key steps:
1. Data Loading and Parsing#
Load ShakeMap XML data containing seismic intensity measurements
Parse XML structure to extract grid fields and data values
Convert raw XML data into structured pandas DataFrame
2. Data Processing#
Extract seismic parameters: MMI (Modified Mercalli Intensity), PGA (Peak Ground Acceleration), PGV (Peak Ground Velocity), and PSA03
Create spatial interpolators using nearest neighbor interpolation
Analyze PGA value distributions across different intensity ranges
3. Landslide Data Integration#
Calculate centroids for landslide geometries
Interpolate seismic values at landslide locations using spatial interpolation
4. Visualization and Analysis#
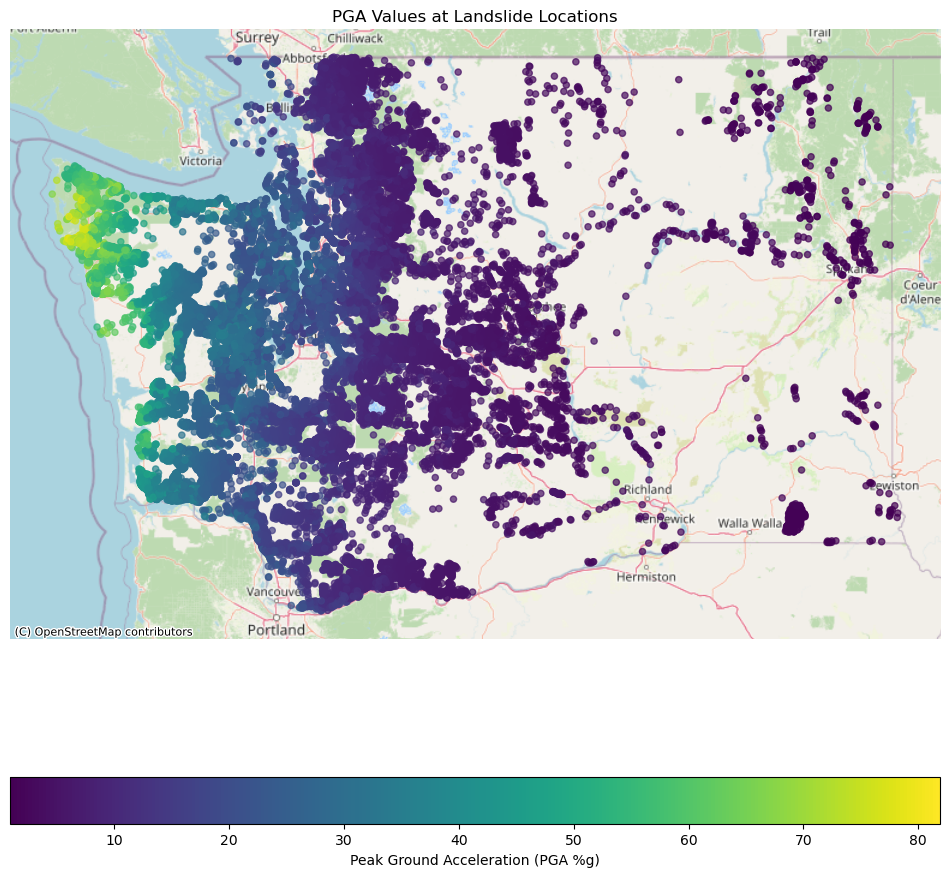
Create choropleth maps showing PGA values at landslide locations
Generate statistical summaries of seismic intensities at landslide sites
Export final integrated dataset with both geometric and seismic attributes
import pandas as pd
import geopandas as gpd
import numpy as np
import xml.etree.ElementTree as ET
import matplotlib.pyplot as plt
from pyproj import Transformer
xml_file = 'shaking/grid.xml'
namespace = {'shakemap': 'http://earthquake.usgs.gov/eqcenter/shakemap'}

# Parse the XML file
tree = ET.parse(xml_file)
root = tree.getroot()
# Get the column names from the <grid_field> tags
fields = root.findall('shakemap:grid_field', namespace)
column_names = [field.get('name') for field in fields]
print(column_names)
['LON', 'LAT', 'MMI', 'PGA', 'PGV', 'PSA03', 'PSA10', 'PSA30', 'SVEL']
# Get the grid data, which is a long string of numbers
grid_data_text = root.find('shakemap:grid_data', namespace).text.strip()
# Use Numpy to convert the string into a numerical array
data_array = np.fromstring(grid_data_text, dtype=float, sep=' ')
# Reshape the 1D array into a 2D table (rows x columns)
num_columns = len(column_names)
data_array_2d = data_array.reshape(-1, num_columns)
# Create a pandas DataFrame from the 2D array
shakemap_df = pd.DataFrame(data_array_2d, columns=column_names)
print(shakemap_df.info())
<class 'pandas.core.frame.DataFrame'>
RangeIndex: 438288 entries, 0 to 438287
Data columns (total 9 columns):
 #   Column  Non-Null Count   Dtype
---  ------  --------------   -----
 0   LON     438288 non-null  float64
 1   LAT     438288 non-null  float64
 2   MMI     438288 non-null  float64
 3   PGA     438288 non-null  float64
 4   PGV     438288 non-null  float64
 5   PSA03   438288 non-null  float64
 6   PSA10   438288 non-null  float64
 7   PSA30   438288 non-null  float64
 8   SVEL    438288 non-null  float64
dtypes: float64(9)
memory usage: 30.1 MB
None
print(len(shakemap_df))
print(shakemap_df.head())
438288
        LON      LAT  MMI    PGA    PGV  PSA03  PSA10  PSA30   SVEL
0 -127.2671  52.5574  4.3  3.148  3.693  7.551  3.124  1.259  900.0
1 -127.2472  52.5574  4.3  3.149  3.694  7.553  3.125  1.260  900.0
2 -127.2273  52.5574  4.3  3.150  3.695  7.555  3.126  1.261  866.7
3 -127.2073  52.5574  4.3  3.142  3.701  7.572  3.130  1.262  600.0
4 -127.1874  52.5574  4.3  3.131  3.710  7.596  3.137  1.263  738.5
# Define the bins for PGA values
# Bins are (0, 2], (2, 4], ..., (48, 50], (50, inf]
bins = list(range(0, 51, 2)) + [float('inf')]

# Create labels for the bins
labels = [f"{bins[i]}-{bins[i+1]}" for i in range(len(bins)-2)] + [f">50"]

# Use pd.cut to categorize PGA values into the defined bins
pga_binned = pd.cut(shakemap_df['PGA'], bins=bins, labels=labels, right=True, include_lowest=True)

# Count the number of values in each bin and sort by the bin range
pga_counts = pga_binned.value_counts().sort_index()

# Print the counts
print("PGA Value Counts in Different Ranges:")
print(pga_counts)
PGA Value Counts in Different Ranges:
PGA
0-2      135275
2-4       83712
4-6       41216
6-8       22319
8-10      18737
10-12     14483
12-14     12017
14-16      9822
16-18      8715
18-20      6961
20-22      6344
22-24      6000
24-26      6352
26-28      5276
28-30      4784
30-32      4371
32-34      3504
34-36      3141
36-38      3076
38-40      2748
40-42      2570
42-44      2509
44-46      2499
46-48      2589
48-50      2534
>50       26734
Name: count, dtype: int64
open dataset#
landslide_ds_path = "../PreProcessing/processed_geojson/washington_landslides_processed_v2.geojson"
ds_name = "washington"
landslides_gdf = gpd.read_file(landslide_ds_path)
from scipy.interpolate import NearestNDInterpolator
import numpy as np

points = np.column_stack((shakemap_df['LON'], shakemap_df['LAT']))

interpolators = {
    field: NearestNDInterpolator(points, shakemap_df[field].values)
    for field in ['MMI', 'PGA', 'PGV', 'PSA03']
}
# Calculate the centroid for all geometries. For points, the centroid is the point itself.
landslides_gdf['centroid'] = landslides_gdf.geometry.centroid

# Ensure the centroid coordinates are in WGS84 (EPSG:4326)
landslides_gdf['centroid'] = landslides_gdf['centroid'].to_crs(epsg=4326)

# Extract longitude and latitude from the centroid
cr = landslides_gdf['centroid']
landslides_gdf['lon'] = cr.x
landslides_gdf['lat'] = cr.y

# Drop rows where longitude or latitude is missing
landslides_gdf.dropna(subset=['lon', 'lat'], inplace=True)

# Prepare the query points for interpolation
query_points_combined = landslides_gdf[['lon', 'lat']].values

# Interpolate PGA, MMI, and PGV values using the existing interpolators
landslides_gdf['filter_PGA'] = interpolators['PGA'](query_points_combined)
landslides_gdf['filter_MMI'] = interpolators['MMI'](query_points_combined)
landslides_gdf['filter_PGV'] = interpolators['PGV'](query_points_combined)
landslides_gdf['filter_PSA03'] = interpolators['PSA03'](query_points_combined)

# Display the head of the updated dataframe with the new columns
print(landslides_gdf[['lon', 'lat', 'filter_PGA', 'filter_MMI', 'filter_PGV']].head())
          lon        lat  filter_PGA  filter_MMI  filter_PGV
0 -122.892431  46.993964       29.33         7.0       27.67
3 -122.942050  47.120019       24.45         7.3       34.02
5 -122.903901  47.131744       27.47         7.5       38.16
6 -123.009570  46.796240       27.92         6.7       21.45
7 -122.986060  47.137527       33.31         7.5       39.01
import contextily as cx

# Ensure the geometry is set to the 'centroid' column for plotting
landslides_gdf = landslides_gdf.set_geometry("centroid")
# Re-project the GeoDataFrame to Web Mercator (EPSG:3857) which is required by contextily
landslides_gdf_wm = landslides_gdf.to_crs(epsg=3857)

# Create the plot
fig, ax = plt.subplots(figsize=(12, 12))
# Plot the landslide data
landslides_gdf_wm.plot(column='filter_PGA',
                                ax=ax,
                                legend=True,
                                cmap='viridis',
                                alpha=0.7,
                                markersize=20,
                                legend_kwds={'label': "Peak Ground Acceleration (PGA %g)",
                                            'orientation': "horizontal"})

# Add the basemap
cx.add_basemap(ax, source=cx.providers.OpenStreetMap.Mapnik)

# Set title and remove axis labels for a cleaner map look
ax.set_title('PGA Values at Landslide Locations')
ax.set_axis_off()
plt.show()
landslides_gdf.head()
| LANDSLIDE_ID | MATERIAL | MOVEMENT | MOVE_CODE | CONFIDENCE | RELATIVE_AGE | YEAR_MOVE | FIELD_VERIFIED | SLOPE_DEG | HS_HEIGHT_FT | ... | filter_MATERIAL | filter_CONFIDENCE | geometry | centroid | lon | lat | filter_PGA | filter_MMI | filter_PGV | filter_PSA03 | |
|---|---|---|---|---|---|---|---|---|---|---|---|---|---|---|---|---|---|---|---|---|---|
| 0 | 18414 | Earth or debris | Flow | EFL | Low (1-10) | Pre-historic (>150 years) | None | No | 11.0 | 3.0 | ... | Earth or debris | Low (1-10) | MULTIPOLYGON (((1043516.638 614643.978, 104351... | POINT (-122.89243 46.99396) | -122.892431 | 46.993964 | 29.33 | 7.0 | 27.67 | 70.45 |
| 3 | 20661 | Earth or debris | Topple | ET | Moderate (11-29) | Pre-historic (>150 years) | None | No | 61.0 | 24.0 | ... | Earth or debris | Moderate (11-29) | MULTIPOLYGON (((1032543.812 660981.578, 103254... | POINT (-122.94205 47.12002) | -122.942050 | 47.120019 | 24.45 | 7.3 | 34.02 | 64.60 |
| 5 | 20392 | Earth or debris | Slide-Rotational | ES-R | Low (1-10) | Pre-historic (>150 years) | None | No | 34.0 | 15.0 | ... | Earth or debris | Low (1-10) | MULTIPOLYGON (((1042187.543 664959.22, 1042188... | POINT (-122.9039 47.13174) | -122.903901 | 47.131744 | 27.47 | 7.5 | 38.16 | 78.29 |
| 6 | 18573 | Earth or debris | Flow | EFL | Low (1-10) | Pre-historic (>150 years) | None | No | 29.0 | 6.0 | ... | Earth or debris | Low (1-10) | MULTIPOLYGON (((1011999.104 543485.112, 101200... | POINT (-123.00957 46.79624) | -123.009570 | 46.796240 | 27.92 | 6.7 | 21.45 | 81.83 |
| 7 | 20357 | Earth or debris | Flow | EFL | Low (1-10) | Pre-historic (>150 years) | None | No | 20.0 | 9.0 | ... | Earth or debris | Low (1-10) | MULTIPOLYGON (((1021808.655 667705.559, 102181... | POINT (-122.98606 47.13753) | -122.986060 | 47.137527 | 33.31 | 7.5 | 39.01 | 79.19 |
5 rows × 58 columns
Rainfall#
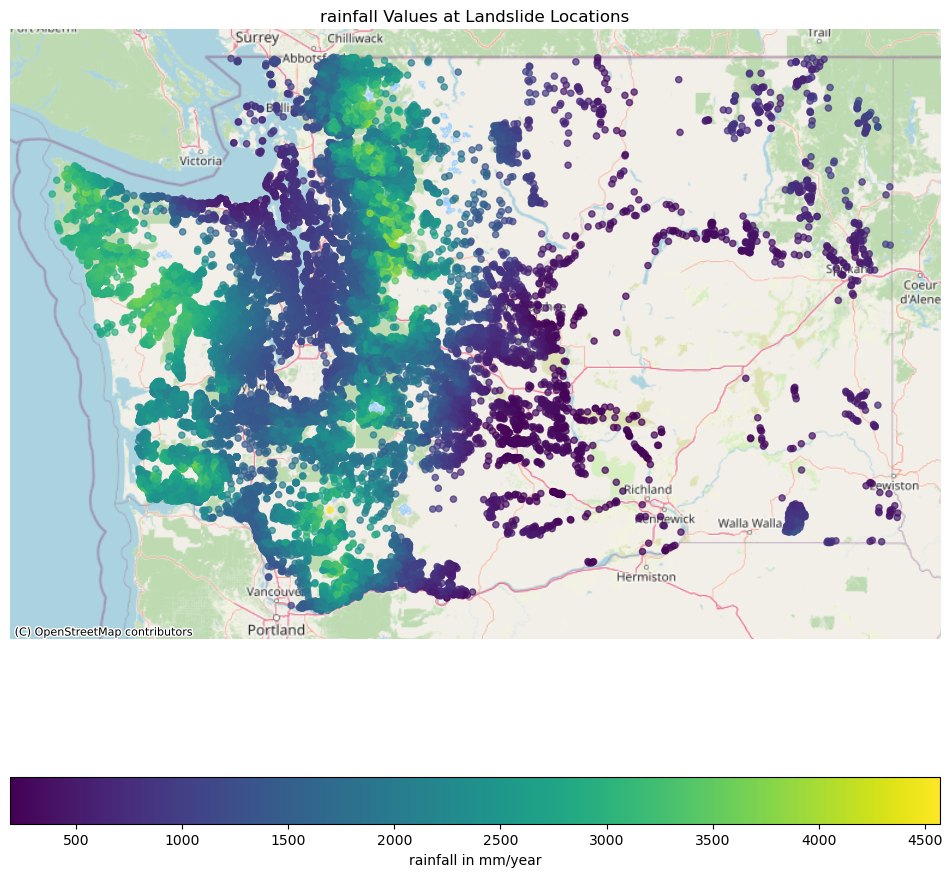
30 years average annual rainfall data from: 30-Year (1990-2019) Annual Average of DAYMET Precipitation and Temperature for North America https://doi.org/10.5066/P9E0JZ82
import rasterio
from rasterio.transform import rowcol

rain_tif = "./rainfall-data/PPT9019.tif"

with rasterio.open(rain_tif) as src:
    # Transform lon/lat (EPSG:4326) -> raster CRS (NAD83 / Albers)
    tf = Transformer.from_crs("EPSG:4326", src.crs, always_xy=True)
    xs, ys = tf.transform(landslides_gdf["lon"].values, landslides_gdf["lat"].values)

    # Identify which transformed points fall inside the raster bounds
    b = src.bounds
    in_bounds = (
        (xs >= b.left) & (xs <= b.right) &
        (ys >= b.bottom) & (ys <= b.top)
    )

    # Prepare output array, default to NaN
    vals = np.full(len(xs), np.nan, dtype="float64")

    # Sample only the points that are in-bounds
    coords_in = np.column_stack([xs[in_bounds], ys[in_bounds]])
    if len(coords_in) > 0:
        sampled = list(src.sample(coords_in))  # each is an array of band values
        sampled = np.array([s[0] for s in sampled], dtype="float64")

        # Replace raster NoData with NaN, if defined
        if src.nodata is not None:
            sampled[sampled == src.nodata] = np.nan

        vals[in_bounds] = sampled

# Add the column to your GeoDataFrame
landslides_gdf["filter_RAINFALL"] = vals
landslides_gdf.head()
| LANDSLIDE_ID | MATERIAL | MOVEMENT | MOVE_CODE | CONFIDENCE | RELATIVE_AGE | YEAR_MOVE | FIELD_VERIFIED | SLOPE_DEG | HS_HEIGHT_FT | ... | filter_CONFIDENCE | geometry | centroid | lon | lat | filter_PGA | filter_MMI | filter_PGV | filter_PSA03 | filter_RAINFALL | |
|---|---|---|---|---|---|---|---|---|---|---|---|---|---|---|---|---|---|---|---|---|---|
| 0 | 18414 | Earth or debris | Flow | EFL | Low (1-10) | Pre-historic (>150 years) | None | No | 11.0 | 3.0 | ... | Low (1-10) | MULTIPOLYGON (((1043516.638 614643.978, 104351... | POINT (-122.89243 46.99396) | -122.892431 | 46.993964 | 29.33 | 7.0 | 27.67 | 70.45 | 1384.876221 |
| 3 | 20661 | Earth or debris | Topple | ET | Moderate (11-29) | Pre-historic (>150 years) | None | No | 61.0 | 24.0 | ... | Moderate (11-29) | MULTIPOLYGON (((1032543.812 660981.578, 103254... | POINT (-122.94205 47.12002) | -122.942050 | 47.120019 | 24.45 | 7.3 | 34.02 | 64.60 | 1503.936035 |
| 5 | 20392 | Earth or debris | Slide-Rotational | ES-R | Low (1-10) | Pre-historic (>150 years) | None | No | 34.0 | 15.0 | ... | Low (1-10) | MULTIPOLYGON (((1042187.543 664959.22, 1042188... | POINT (-122.9039 47.13174) | -122.903901 | 47.131744 | 27.47 | 7.5 | 38.16 | 78.29 | 1421.002563 |
| 6 | 18573 | Earth or debris | Flow | EFL | Low (1-10) | Pre-historic (>150 years) | None | No | 29.0 | 6.0 | ... | Low (1-10) | MULTIPOLYGON (((1011999.104 543485.112, 101200... | POINT (-123.00957 46.79624) | -123.009570 | 46.796240 | 27.92 | 6.7 | 21.45 | 81.83 | 1401.459595 |
| 7 | 20357 | Earth or debris | Flow | EFL | Low (1-10) | Pre-historic (>150 years) | None | No | 20.0 | 9.0 | ... | Low (1-10) | MULTIPOLYGON (((1021808.655 667705.559, 102181... | POINT (-122.98606 47.13753) | -122.986060 | 47.137527 | 33.31 | 7.5 | 39.01 | 79.19 | 1567.274048 |
5 rows × 59 columns
import contextily as cx

# Ensure the geometry is set to the 'centroid' column for plotting
landslides_gdf = landslides_gdf.set_geometry("centroid")
# Re-project the GeoDataFrame to Web Mercator (EPSG:3857) which is required by contextily
landslides_gdf_wm = landslides_gdf.to_crs(epsg=3857)

# Create the plot
fig, ax = plt.subplots(figsize=(12, 12))
# Plot the landslide data
landslides_gdf_wm.plot(column='filter_RAINFALL',
                                ax=ax,
                                legend=True,
                                cmap='viridis',
                                alpha=0.7,
                                markersize=20,
                                legend_kwds={'label': "rainfall in mm/year",
                                            'orientation': "horizontal"})

# Add the basemap
cx.add_basemap(ax, source=cx.providers.OpenStreetMap.Mapnik)

# Set title and remove axis labels for a cleaner map look
ax.set_title('rainfall Values at Landslide Locations')
ax.set_axis_off()
plt.show()
Add Unique ID#
Generate sequential unique identifiers for all landslide records
# Add a unique ID column to the landslides_gdf
landslides_gdf['viewer_id'] = [
    f"{origin}_{i+1}" for i, origin in enumerate(landslides_gdf['filter_ORIGIN'])
]

print(f"Added unique_id column with {len(landslides_gdf)} unique IDs")
print(landslides_gdf[['filter_ORIGIN', 'viewer_id']].head())
Added unique_id column with 60919 unique IDs
  filter_ORIGIN     viewer_id
0    WASHINGTON  WASHINGTON_1
3    WASHINGTON  WASHINGTON_2
5    WASHINGTON  WASHINGTON_3
6    WASHINGTON  WASHINGTON_4
7    WASHINGTON  WASHINGTON_5
Save the Landslides#
# Keep the original geometry column and remove centroid
gdf_export_original = landslides_gdf.copy()
gdf_export_original = gdf_export_original.set_geometry('geometry')  # Set original geometry as active
gdf_export_original = gdf_export_original.drop('centroid', axis=1)  # Remove the centroid geometry column

# Export with original geometry
gdf_export_original.to_file(f"final_{ds_name}_v2.geojson", driver="GeoJSON")
print(f"✓ Successfully saved with original geometry to: final_{ds_name}_v2.geojson")
✓ Successfully saved with original geometry to: final_washington_v2.geojson