Ducellier and Creager (2022)
An 8-Year-Long Low-Frequency Earthquake Catalog for Southern Cascadia
A. Ducellier and K. G. Creager

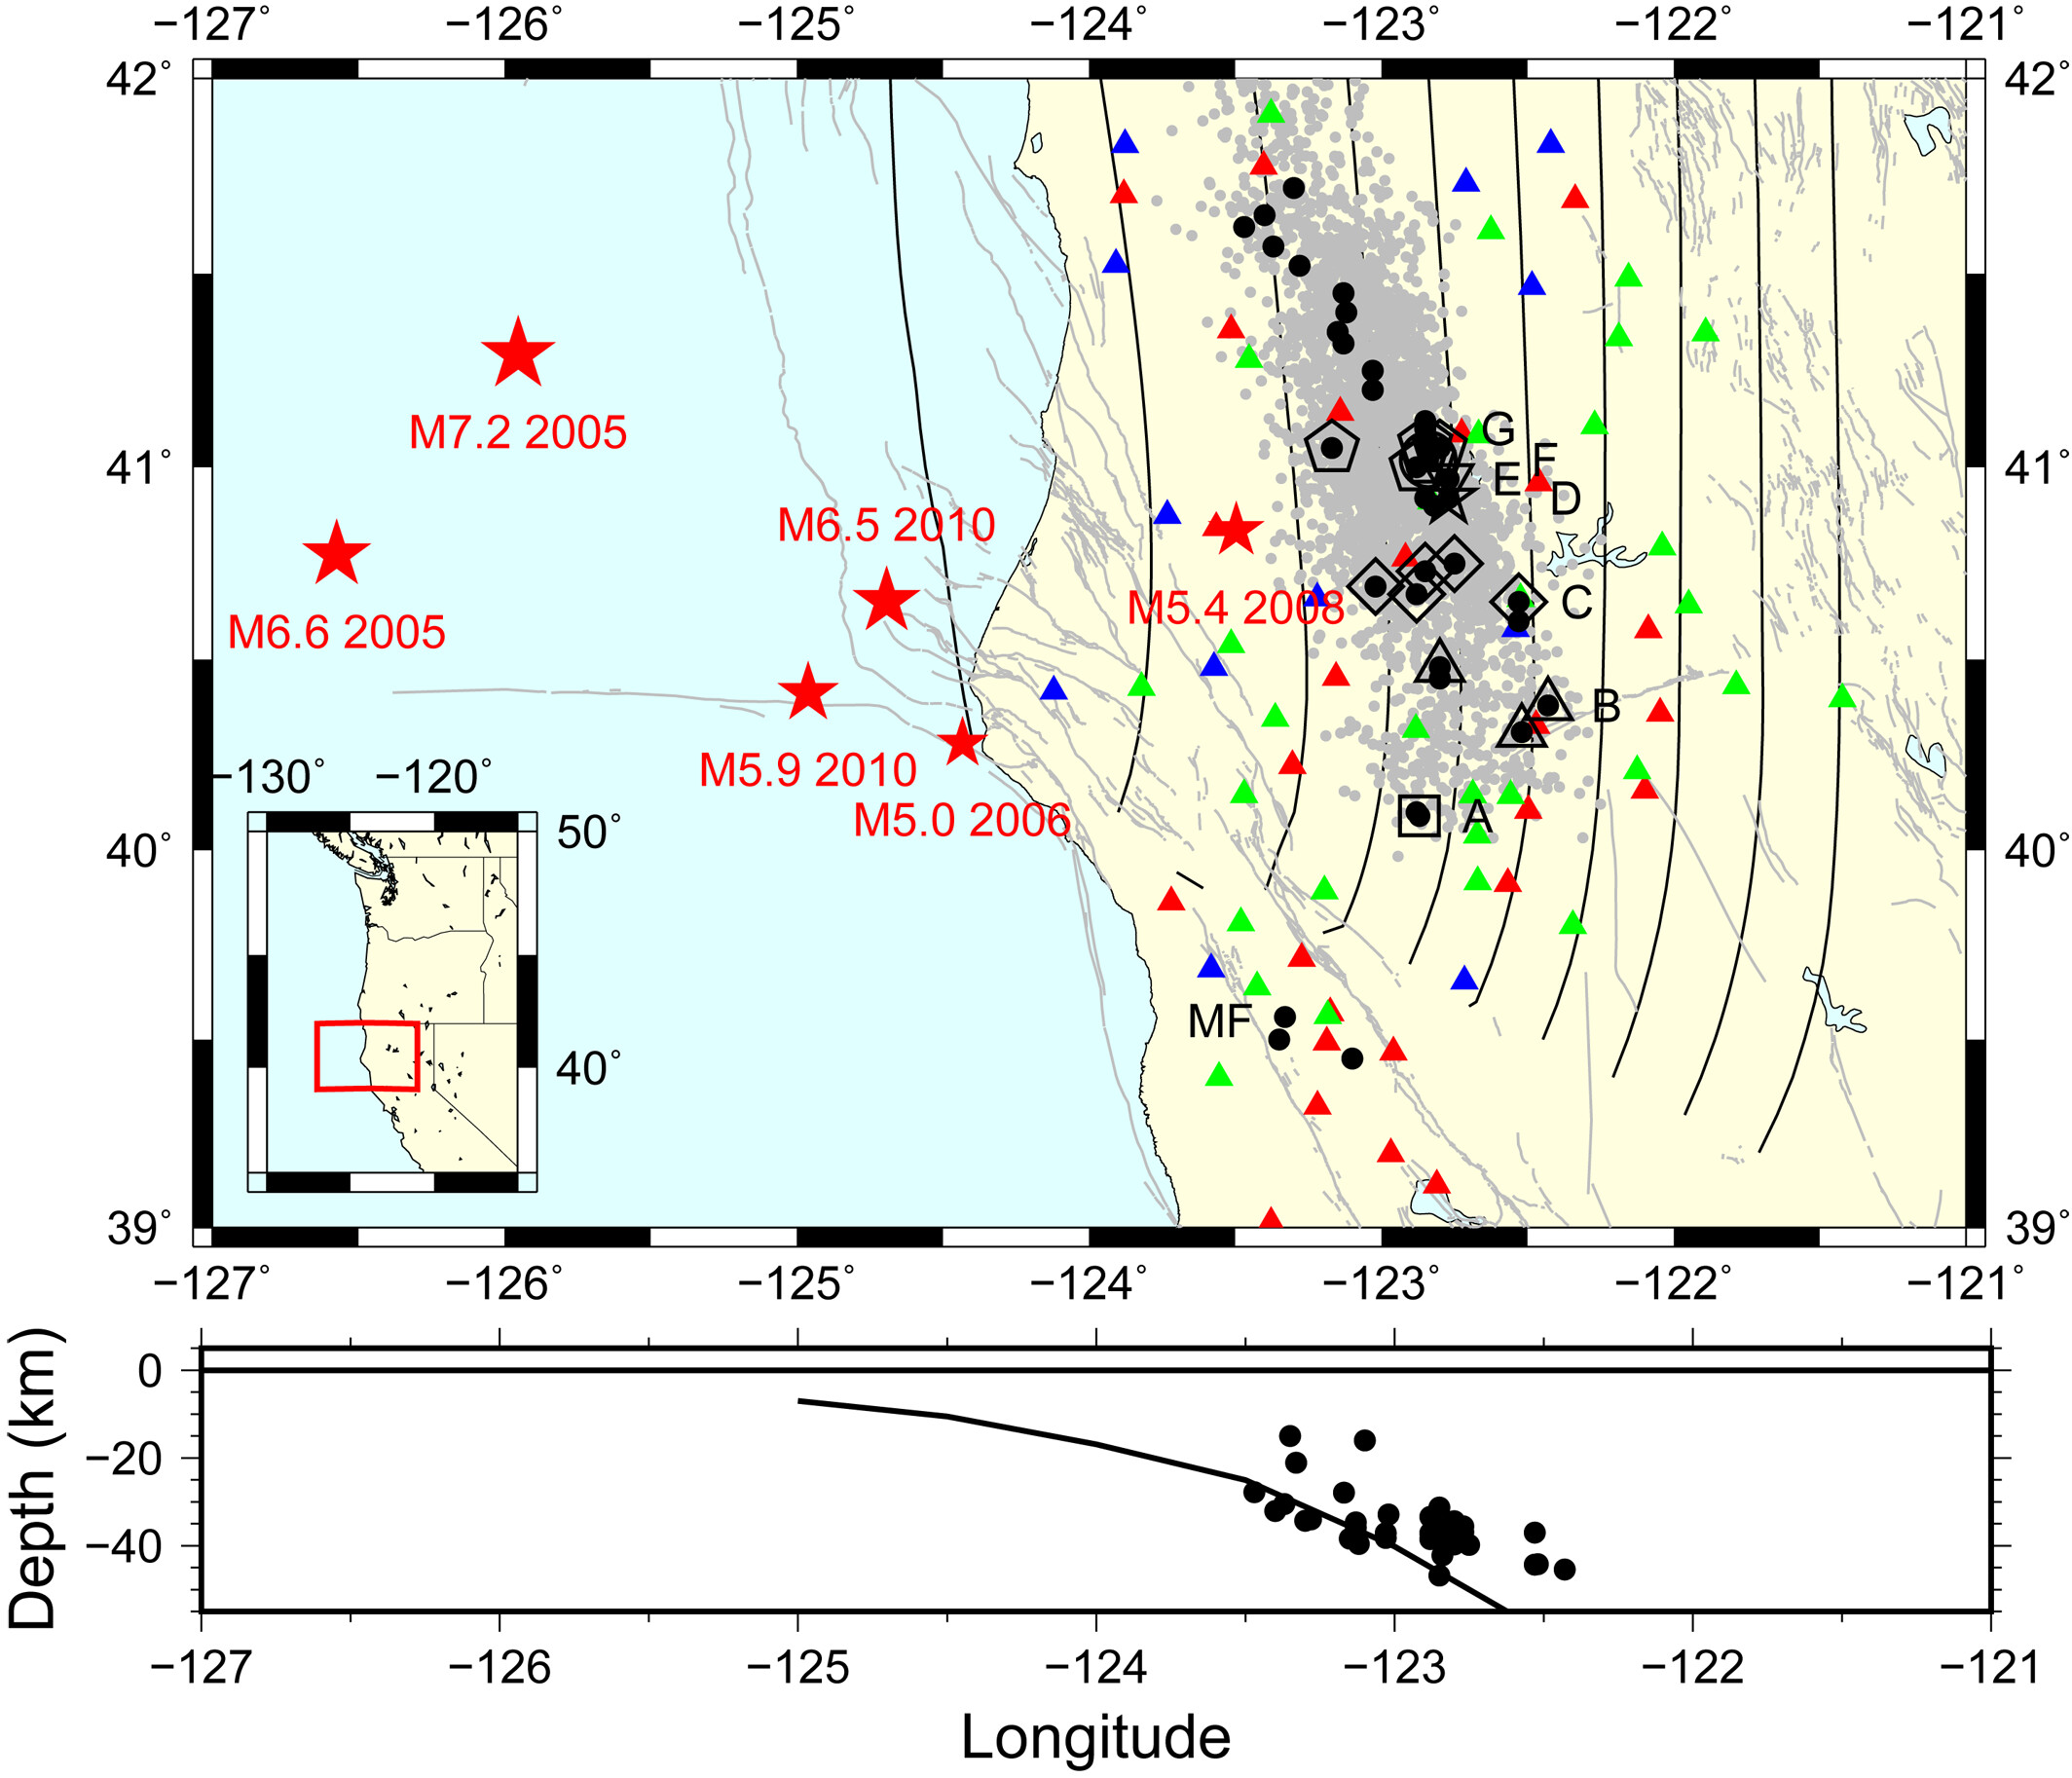
Figure 1:Map showing the location of the low-frequency earthquake (LFE) families (black dots) and the seismic stations used in this study. Red triangles are the stations from the Flexible Array Mendocino Experiment, green triangles are one-component permanent stations, and blue triangles are three components permanent stations. Red stars are moderate (M > 5) nearby earthquakes. The plate boundary from McCrory et al. (2006) is contoured at 10-km intervals starting at 10 km depth. The cross section shows the depth of the LFE families (Plourde et al., 2015) and the plate boundary model from McCrory et al. (2006) at a latitude of 41°N. MF indicates the Maacama Fault. We highlighted with different shapes the LFE families or groups of LFE families that are discussed later in the text. The black square is for family A, the black triangles are for families B1–B3, the black diamonds are for families C1–C5, the black star is for family D, the inverted triangle is for family E, the circle is for family F, and the pentagons are for families G1–G5.
Summary
Low-frequency earthquakes (LFEs) are small magnitude earthquakes with typical magnitude less than 2 and reduced amplitudes at frequencies greater than 10 Hz relative to ordinary small earthquakes. Their occurrence is often associated with tectonic tremor and slow-slip events along the plate boundary in subduction zones and occasionally transform fault zones. They are usually grouped into families with all the earthquakes of a given family originating from the same small patch on the plate interface and recurring more or less episodically in a bursty manner. In this study, we extend the LFE catalog obtained by Plourde et al. (2015) during an episode of high tremor activity in April 2008 to the 8-year period 2004–2011. All of the tremors in the Boyarko et al. (2015) catalog south of 42° North have associated LFE activity, but we have identified several smaller episodes of LFEs without associated tremor activity, and extend their catalog forward and backward by a total of about 3 years. As in northern Cascadia, the downdip LFE families have recurrence intervals several times smaller than the updip families. For the April 2008 Episodic Tremor and Slip event, the best recorded LFE families exhibit a strong tidal Coulomb stress sensitivity starting 1.5 days after the rupture front passes by each LFE family. The southernmost LFE family, which has been interpreted to be on the subduction plate boundary, near the updip limit of tremor, has a very short recurrence time. Also, these LFEs tend to occur during times when predicted tidal Coulomb stress is discouraging slip on the plate boundary. Both observations suggest that this LFE family may be on a different fault.
Catalog Summary
REGION: Southern Cascadia
TIME SPAN: 2004-2011
EVENT TYPE: Low-frequency Earthquakes
NUMBER OF EVENTS: 477,715 earthquakes
DETECTION METHOD: Template Matching
ASSOCIATION METHOD: Template Matching
LOCATION METHOD: From Plourde et al. (2015)
VELOCITY MODEL: From Plourde et al. (2015)
MAGNITUTE TYPE: N/A
Notes
Locations were determined by Verdonck & Zandt (1994).
- Ducellier, A., & Creager, K. C. (2022). An 8‐Year‐Long Low‐Frequency Earthquake Catalog for Southern Cascadia. Journal of Geophysical Research: Solid Earth, 127(4). 10.1029/2021jb022986
- Plourde, A. P., Bostock, M. G., Audet, P., & Thomas, A. M. (2015). Low‐frequency earthquakes at the southern Cascadia margin. Geophysical Research Letters, 42(12), 4849–4855. 10.1002/2015gl064363
- Boyarko, D. C., Brudzinski, M. R., Porritt, R. W., Allen, R. M., & Tréhu, A. M. (2015). Automated detection and location of tectonic tremor along the entire Cascadia margin from 2005 to 2011. Earth and Planetary Science Letters, 430, 160–170. 10.1016/j.epsl.2015.06.026
- Verdonck, D., & Zandt, G. (1994). Three‐dimensional crustal structure of the Mendocino Triple Junction region from local earthquake travel times. Journal of Geophysical Research: Solid Earth, 99(B12), 23843–23858. 10.1029/94jb01238