cvm_slicer#
The cvm_slicer tool allows for interactive extraction and plotting of data from a CVM netCDF file (2D or 3D). This tutorial guides you through using cvm_slicer on the Cascadia-ANT+RF-Delph2018 model we created with cvm_writer.
Prerequisites#
A CVM model file in netCDF format. If you do not have the netCDF file or want a different file, create it using the cvm_writer or download a CVM file from Google Drive.
Features#
The cvm_slicer works via prompts and user inputs. In all menus:
Use
backto go back to the previous option.Use
exitto exit the tool.If a default value is provided, press the
returnkey to accept the default. Otherwise, input the values you want to use.
Steps#
Navigate to the Model Directory
Change your working directory to the sample files for the Cascadia model:
cd sample-files/Cascadia-ANT+RF-Delph2018
Run the Slicer Tool
Execute the
cvm_slicertool:../../src/cvm_slicer.py -v -i Cascadia-ANT+RF-test.nc
The
-vargument enables verbose mode, providing more detailed information about the required parameters. You can remove this tag to run the tool in a less verbose mode. The-iargument identifiesCascadia-ANT+RF-test.ncas the input netCDF file.It will prompt you with the following option:
[data] select option [meta, range, subset, help, exit]?
Note that the
[data]at the beginning of the prompt indicates the current stage of the process (data input).meta: to see the model metadata
range: to get information on value ranges for variables
subset: to subset the data and extract a slice or a sub-volume of the model
Creating a Depth Slice at 20 km#
To create a depth slice at 20 km, we need to subset the model:
Select the subset Option
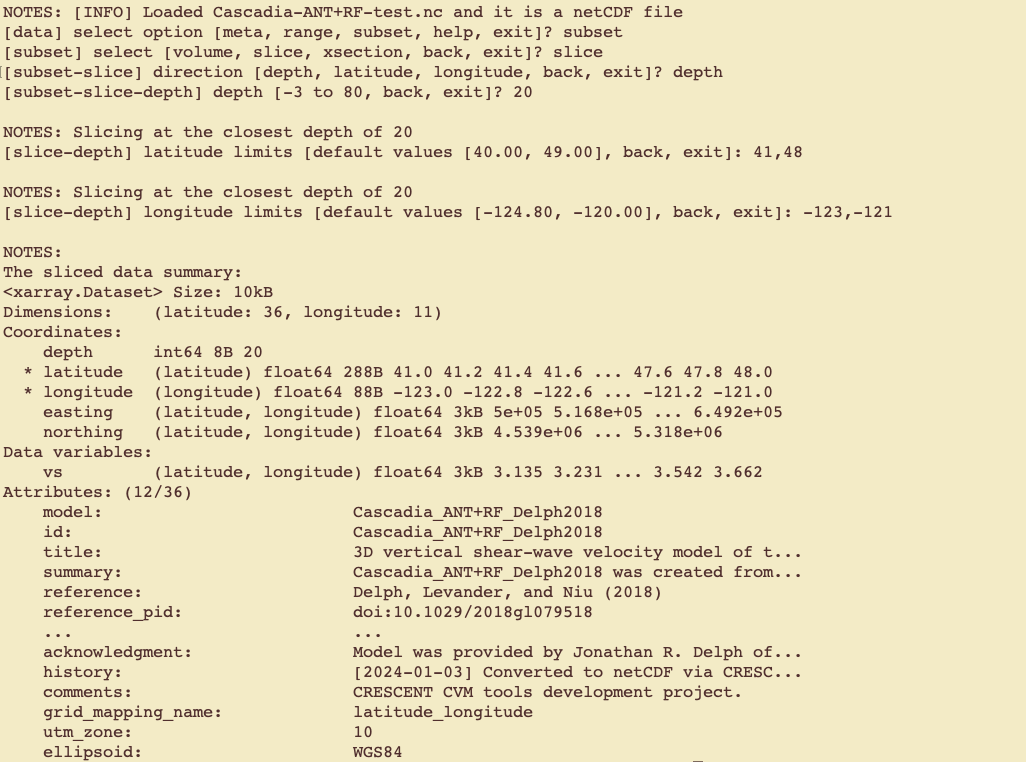
[data] select option [meta, range, subset, help, exit]? subset
It prompts you back with the following options for selecting how you want to subset the model:
[subset] select [volume, slice, xsection, back, exit]?
volume - a sub-volume of data
slice - a slice along a coordinate axis
xsection - a vertical slice in an arbitrary direction
Since we want to create a depth slice, select the
sliceoption.Selecting Slice Direction
[subset] select [volume, slice, xsection, back, exit]? slice
In the slice menu, you have the option to select the coordinate direction (coordinate 1, coordinate 2, or coordinate 3) along which to slice the model. For this model, the variables are defined by depth, latitude, and longitude. Therefore, the prompt will be:
[subset-slice] direction [depth, latitude, longitude, back, exit]?
Since our goal is a depth slice, select depth.
[subset-slice] direction [depth, latitude, longitude, back, exit]? depth
Defining Slice Limits
After selecting depth as the slice direction, define the limits for the slice:
Depth: Enter
20to place the slice at 20 km.Latitude Ranges: Press
Enterto select the entire latitude range, or provide the min and max values within the given range.Longitude Ranges: Press
Enterto select the entire longitude range, or provide the min and max values within the given range.
[subset-slice-depth] depth [-3 to 80, back, exit]? 20
[slice-depth] latitude limits [default values [40.00, 49.00], back, exit]:
[slice-depth] longitude limits [default values [-124.80, -120.00], back, exit]:
Summary and Display Options
After providing the slice parameters, a summary of the slice will be displayed:

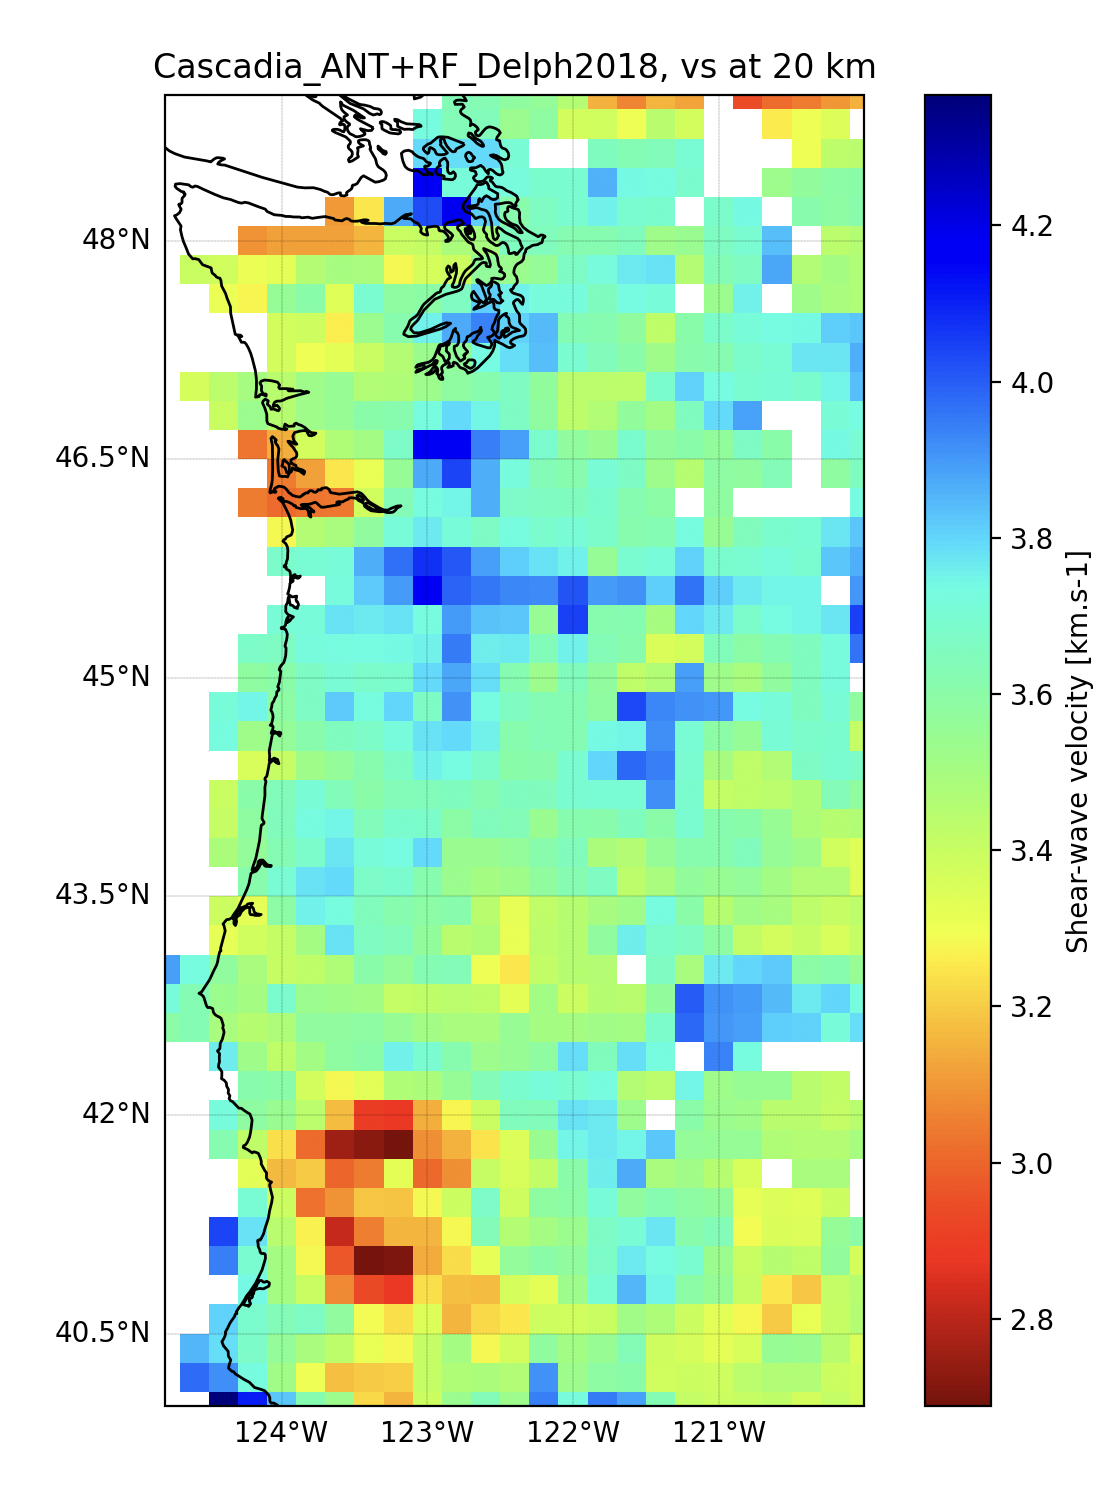
A summary of the selected depth slice at a depth of 20 km. You will also be prompted for what you want to do with the selected slice data:
[slice-depth] Action [plot2d, plot3d, gmap, cmap, save, back, exit]:
plot2d - a 2D plot of [‘latitude’, ‘longitude’]
plot3d - a 3D plot of [‘latitude’, ‘longitude’] and the model variable on the 3rd axis. The plot is interactive and can be rotated.
gmap - a 2D plot of [‘latitude’, ‘longitude’] in a geographical coordinate system
cmap - change the colormap for the plots. You can also provide
cmap,vmin, andvmax, withvminandvmaxdefining the minimum and maximum values for the colormap.save - save the slice data
Below is the plot generated after selecting the
gmapoption:
Depth slice at 20 km depth from gmap option.
Creating a Cross-Section#
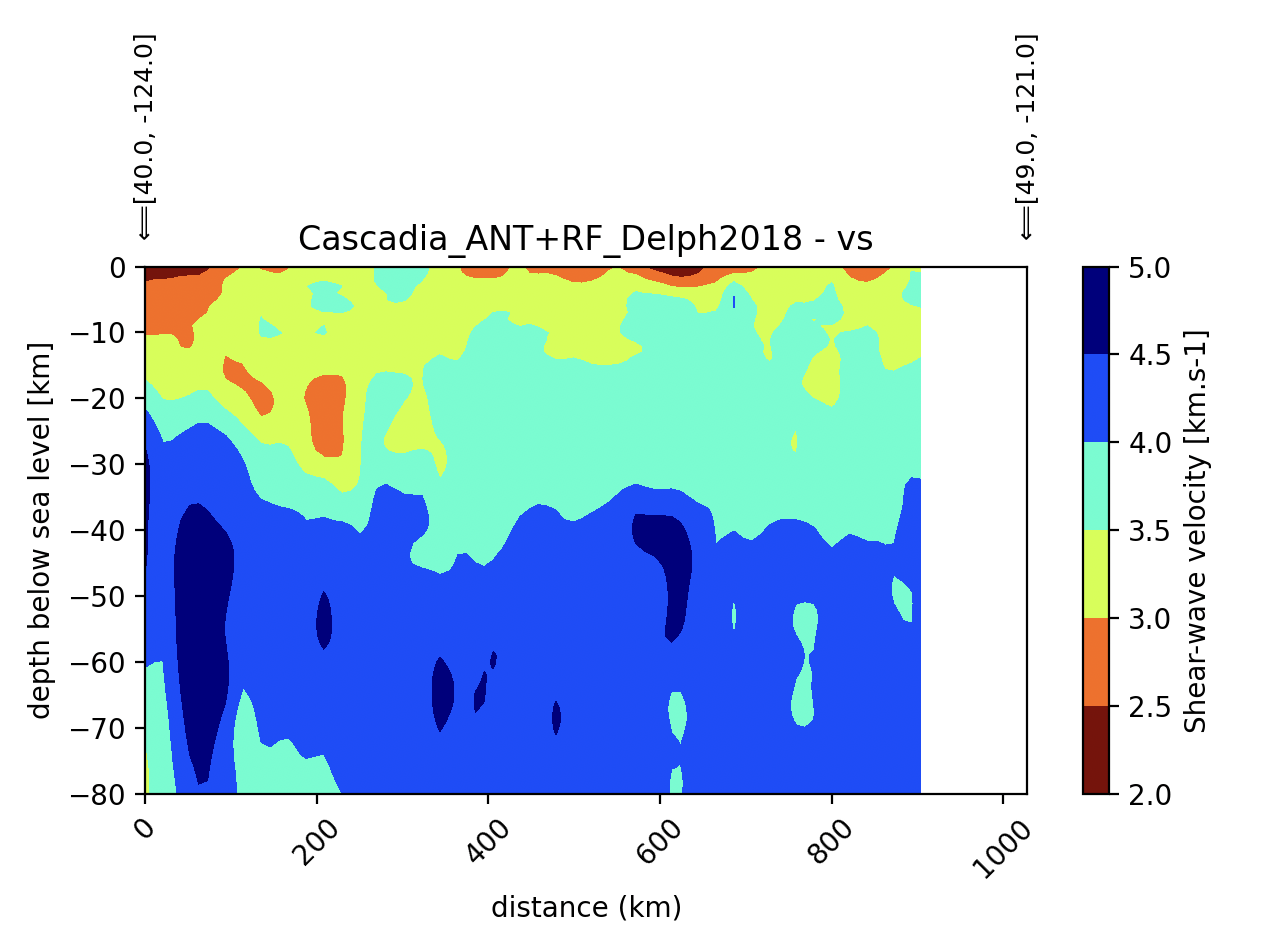
The following are the steps taken to create a cross-section of the model by providing start and end coordinates and the desired depth range.
[data] select option [meta, range, subset, help, exit]? subset
[subset] select [volume, slice, xsection, back, exit]? xsection
The model coordinate ranges for the cross-section are:
depth: -3.00 to 80.00 km
latitude: 40.00 to 49.00 degrees_north
longitude: -124.80 to -120.00 degrees_east
[slice-xsection] Cross-section start point as lat,lon ['back', 'exit']? 40,-124
[slice-xsection] Cross-section end point as lat,lon ['back', 'exit']? 49,-121
[slice-xsection] Cross-section depth range as start, end ['back', 'exit']? 0,80

NOTES: [INFO] grid_mapping_name is latitude_longitude
[xsection] Interpolation Method [linear, nearest, back, exit, default: linear]? linear
[xsection] Number of points ['back', 'exit', default: 100]?
[xsection] Vertical exaggeration (0: dynamic aspect ratio)['back', 'exit', default: 0]?

Conclusion#
Follow the same logic as the two examples above to explore other types of plots and data extractions available via the cvm_slicer tool.
For 2D netCDF files, the process remains the same, with the exception that only 2D surface plots are supported.
